Monitor and Dashboard
Kube-OVN can export network control plane information and network data plane quality information metrics to the external in formats supported by Prometheus.
We use the CRD provided by kube-prometheus to define the corresponding Prometheus monitoring rules. For all monitoring metrics supported by Kube-OVN, please refer to Kube-OVN Monitoring Metrics.
If you are using native Prometheus, please refer to Configuring Native Prometheus for configuration.
Install Prometheus Monitor
Kube-OVN uses Prometheus Monitor CRD to manage the monitoring output.
# network quality related monitoring metrics
kubectl apply -f https://raw.githubusercontent.com/kubeovn/kube-ovn/master/dist/monitoring/pinger-monitor.yaml
# kube-ovn-controller metrics
kubectl apply -f https://raw.githubusercontent.com/kubeovn/kube-ovn/master/dist/monitoring/controller-monitor.yaml
# kube-ovn-cni metrics
kubectl apply -f https://raw.githubusercontent.com/kubeovn/kube-ovn/master/dist/monitoring/cni-monitor.yaml
# ovn metrics
kubectl apply -f https://raw.githubusercontent.com/kubeovn/kube-ovn/master/dist/monitoring/ovn-monitor.yaml
The default interval for Prometheus pull is 15s, if you need to adjust it, modify the interval value in yaml.
Import Grafana Dashboard
Kube-OVN provides a predefined Grafana Dashboard to display control plane and data plane related metrics.
Download the corresponding Dashboard template:
# network quality related monitoring dashboard
wget https://raw.githubusercontent.com/kubeovn/kube-ovn/master/dist/monitoring/pinger-grafana.json
# kube-ovn-controller dashboard
wget https://raw.githubusercontent.com/kubeovn/kube-ovn/master/dist/monitoring/controller-grafana.json
# kube-ovn-cni dashboard
wget https://raw.githubusercontent.com/kubeovn/kube-ovn/master/dist/monitoring/cni-grafana.json
# ovn dashboard
wget https://raw.githubusercontent.com/kubeovn/kube-ovn/master/dist/monitoring/ovn-grafana.json
# ovs dashboard
wget https://raw.githubusercontent.com/kubeovn/kube-ovn/master/dist/monitoring/ovs-grafana.json
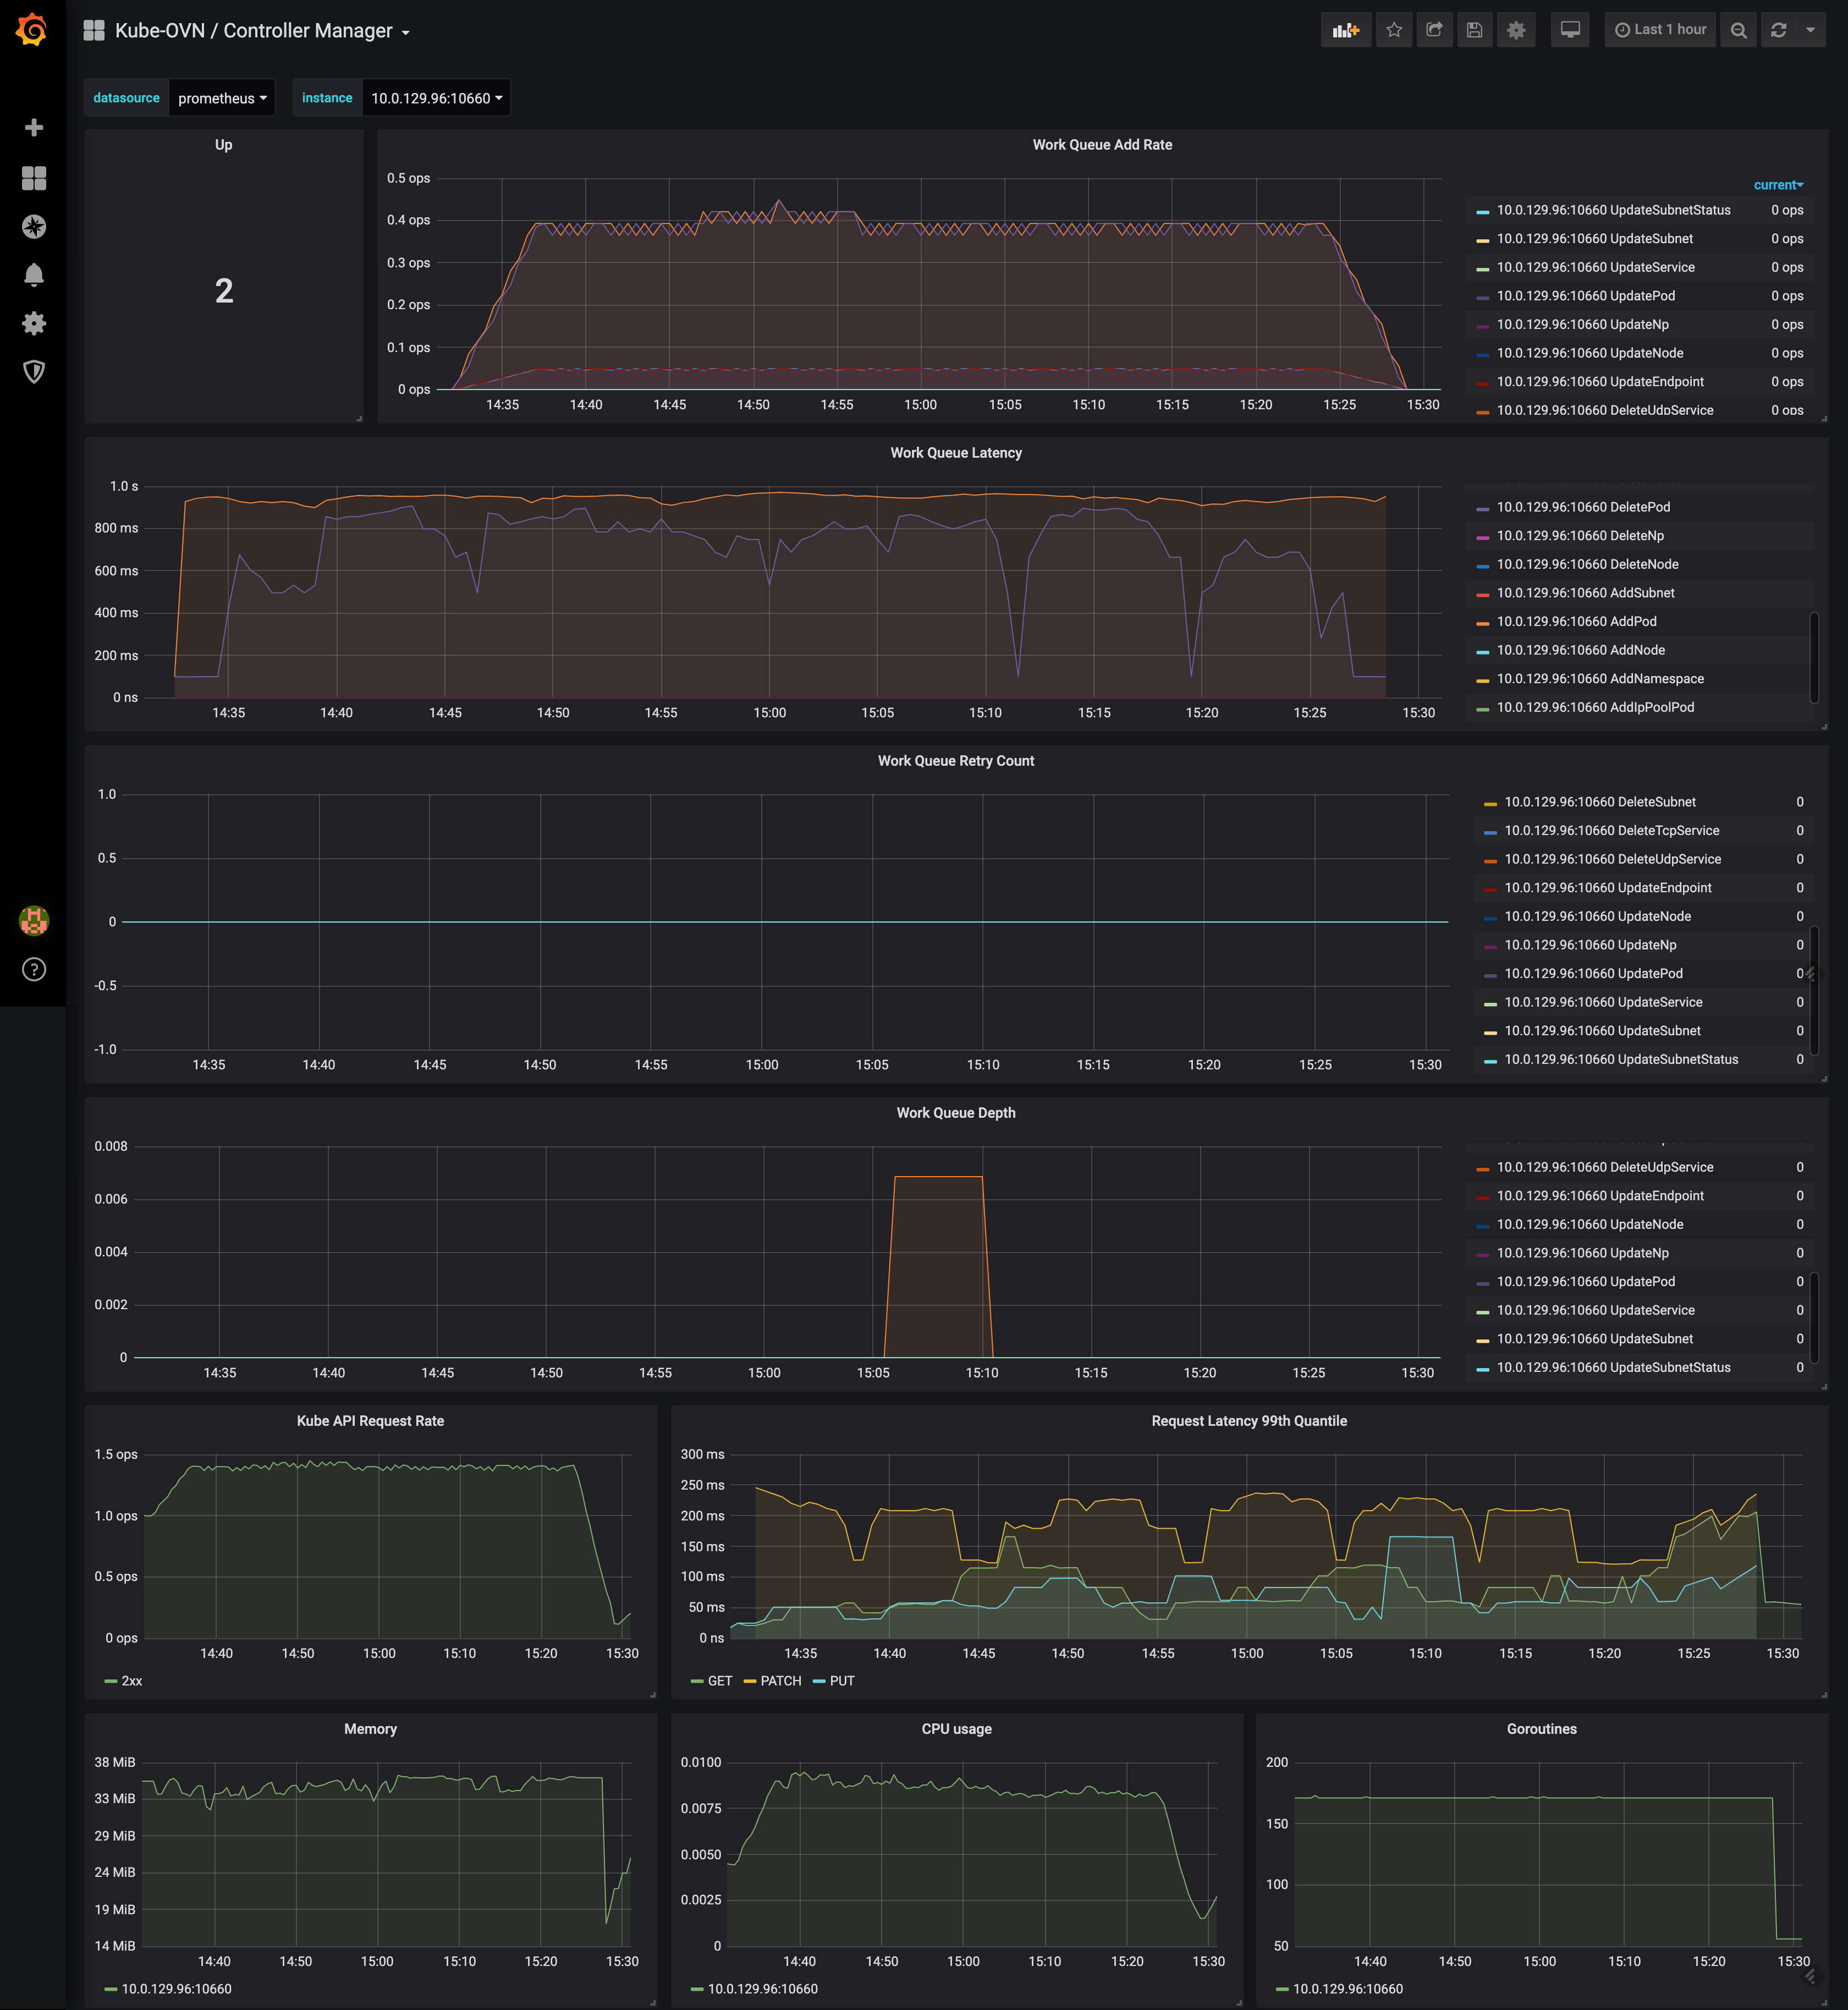
Import these templates into Grafana and set the data source to the corresponding Prometheus to see the following Dashboards.
kube-ovn-controller dashboard:
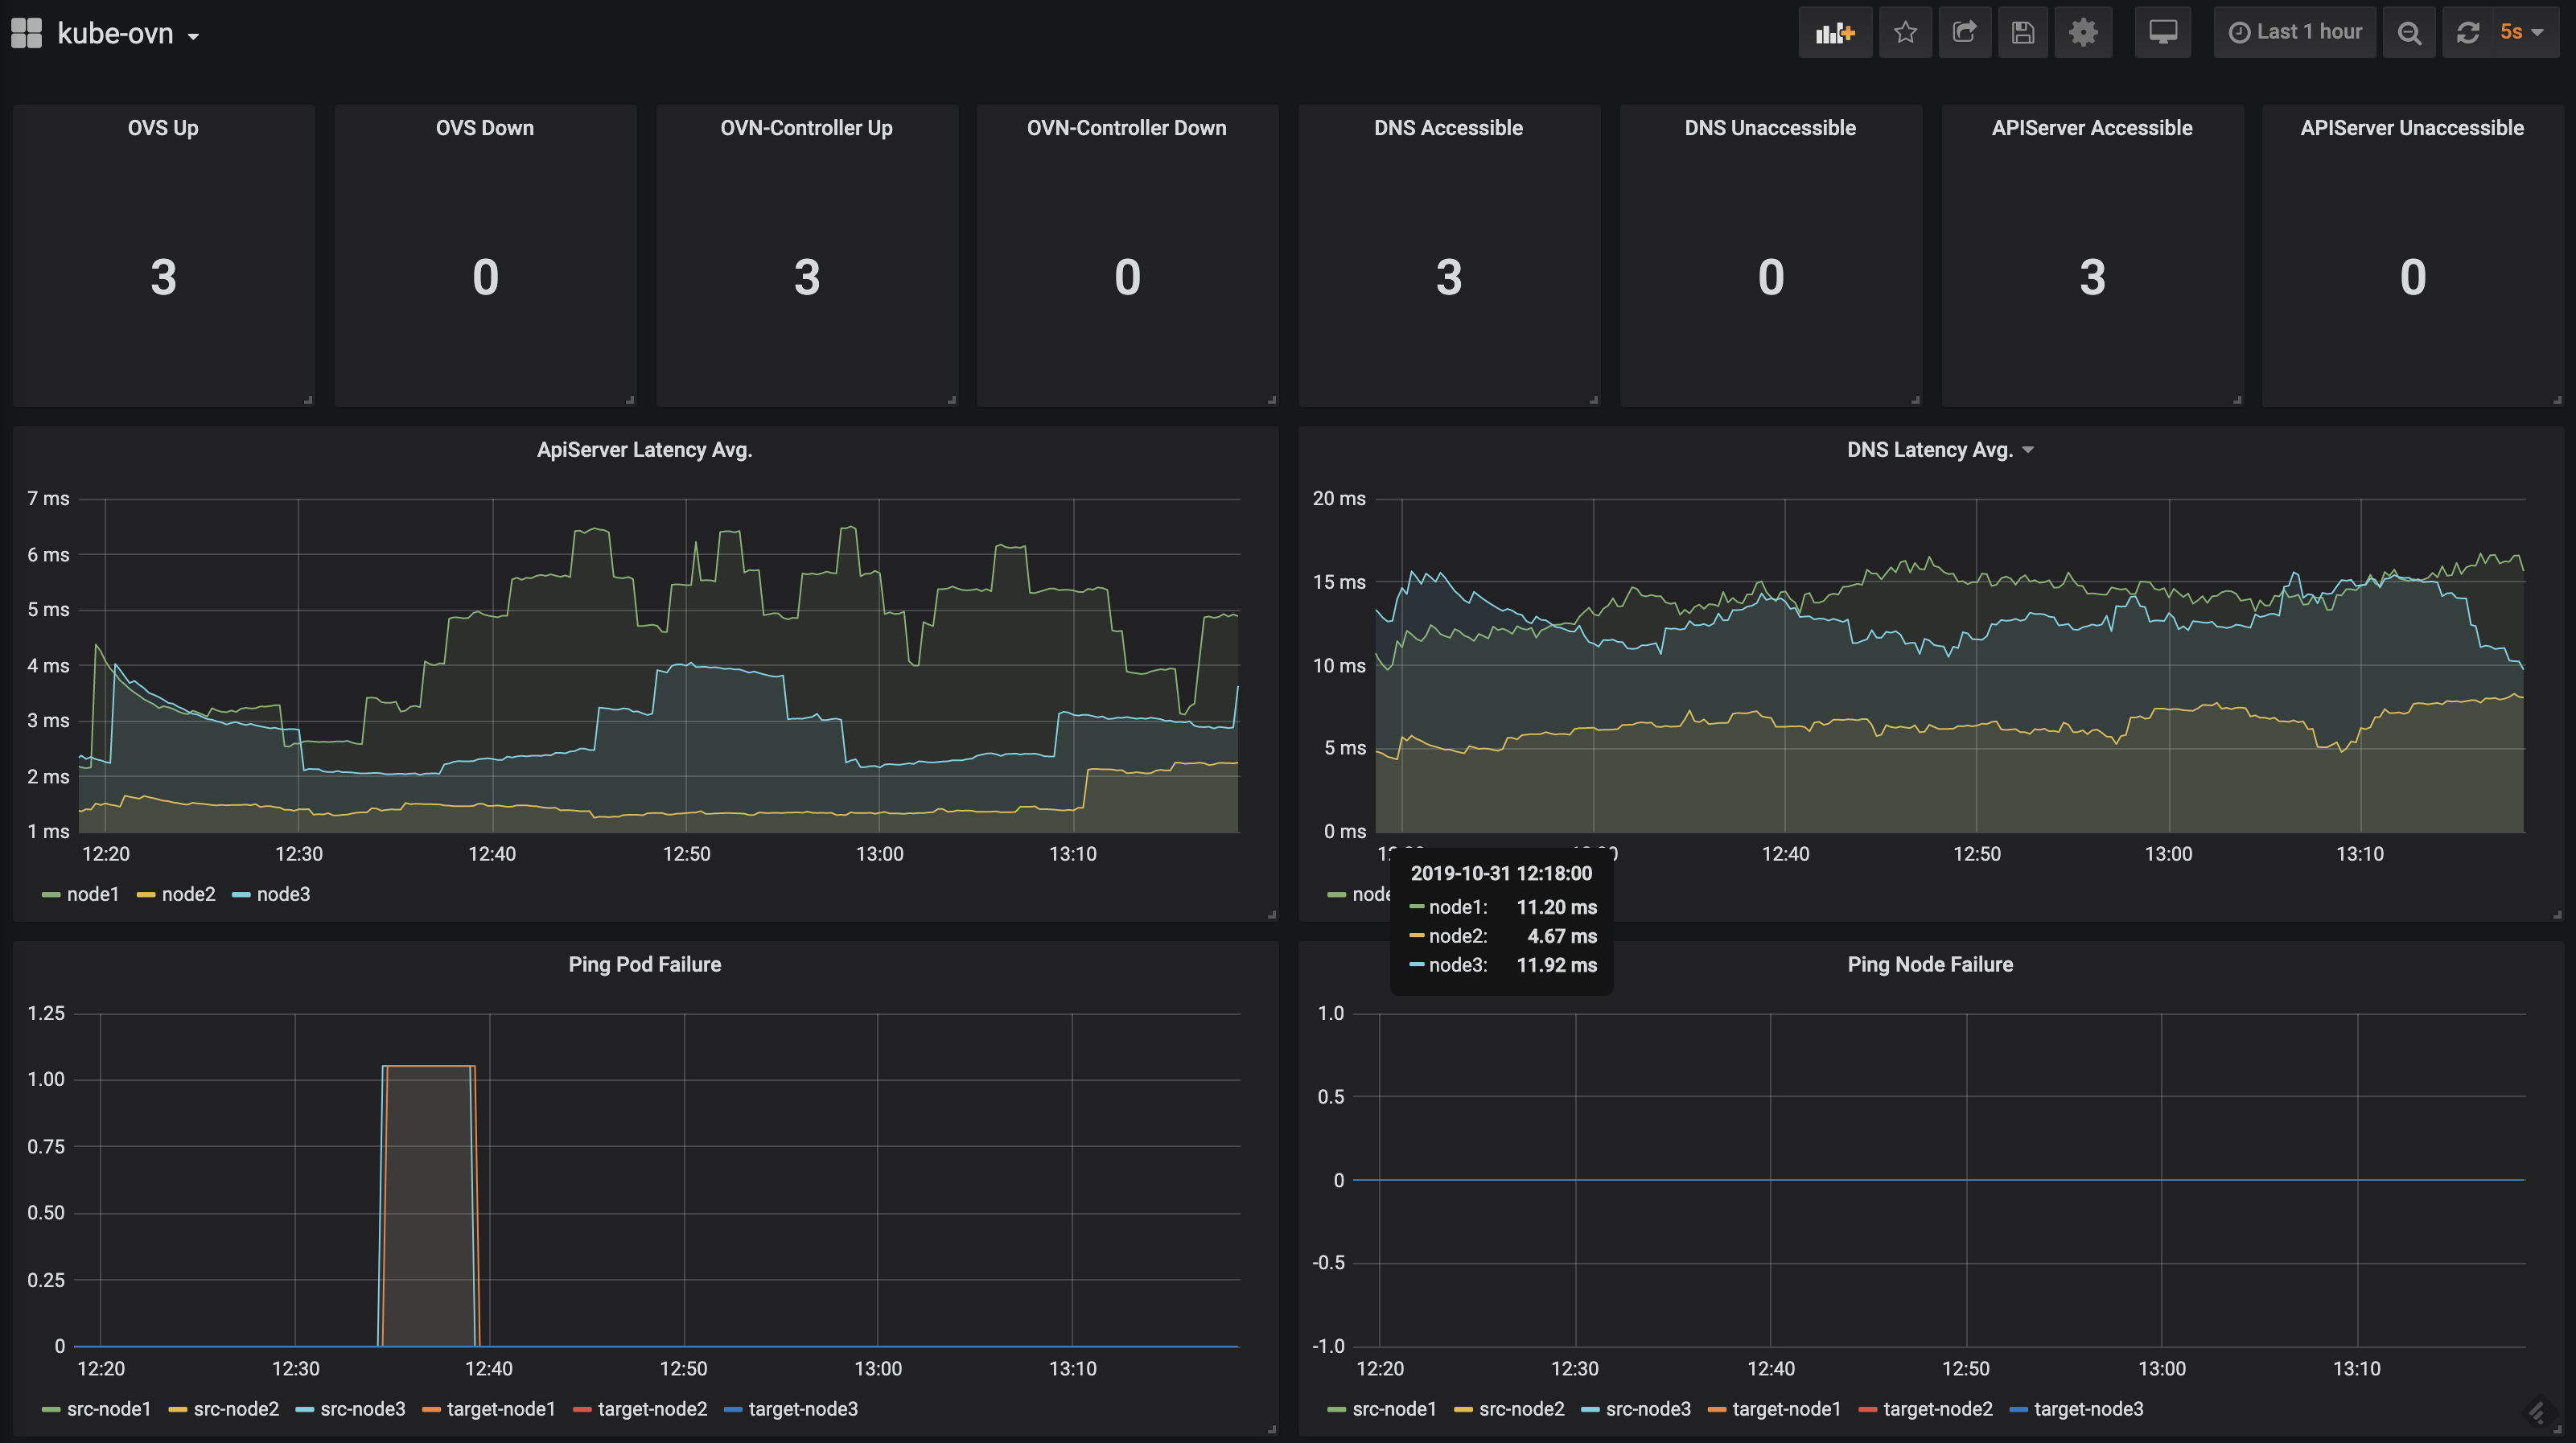
kube-ovn-pinger dashboard:
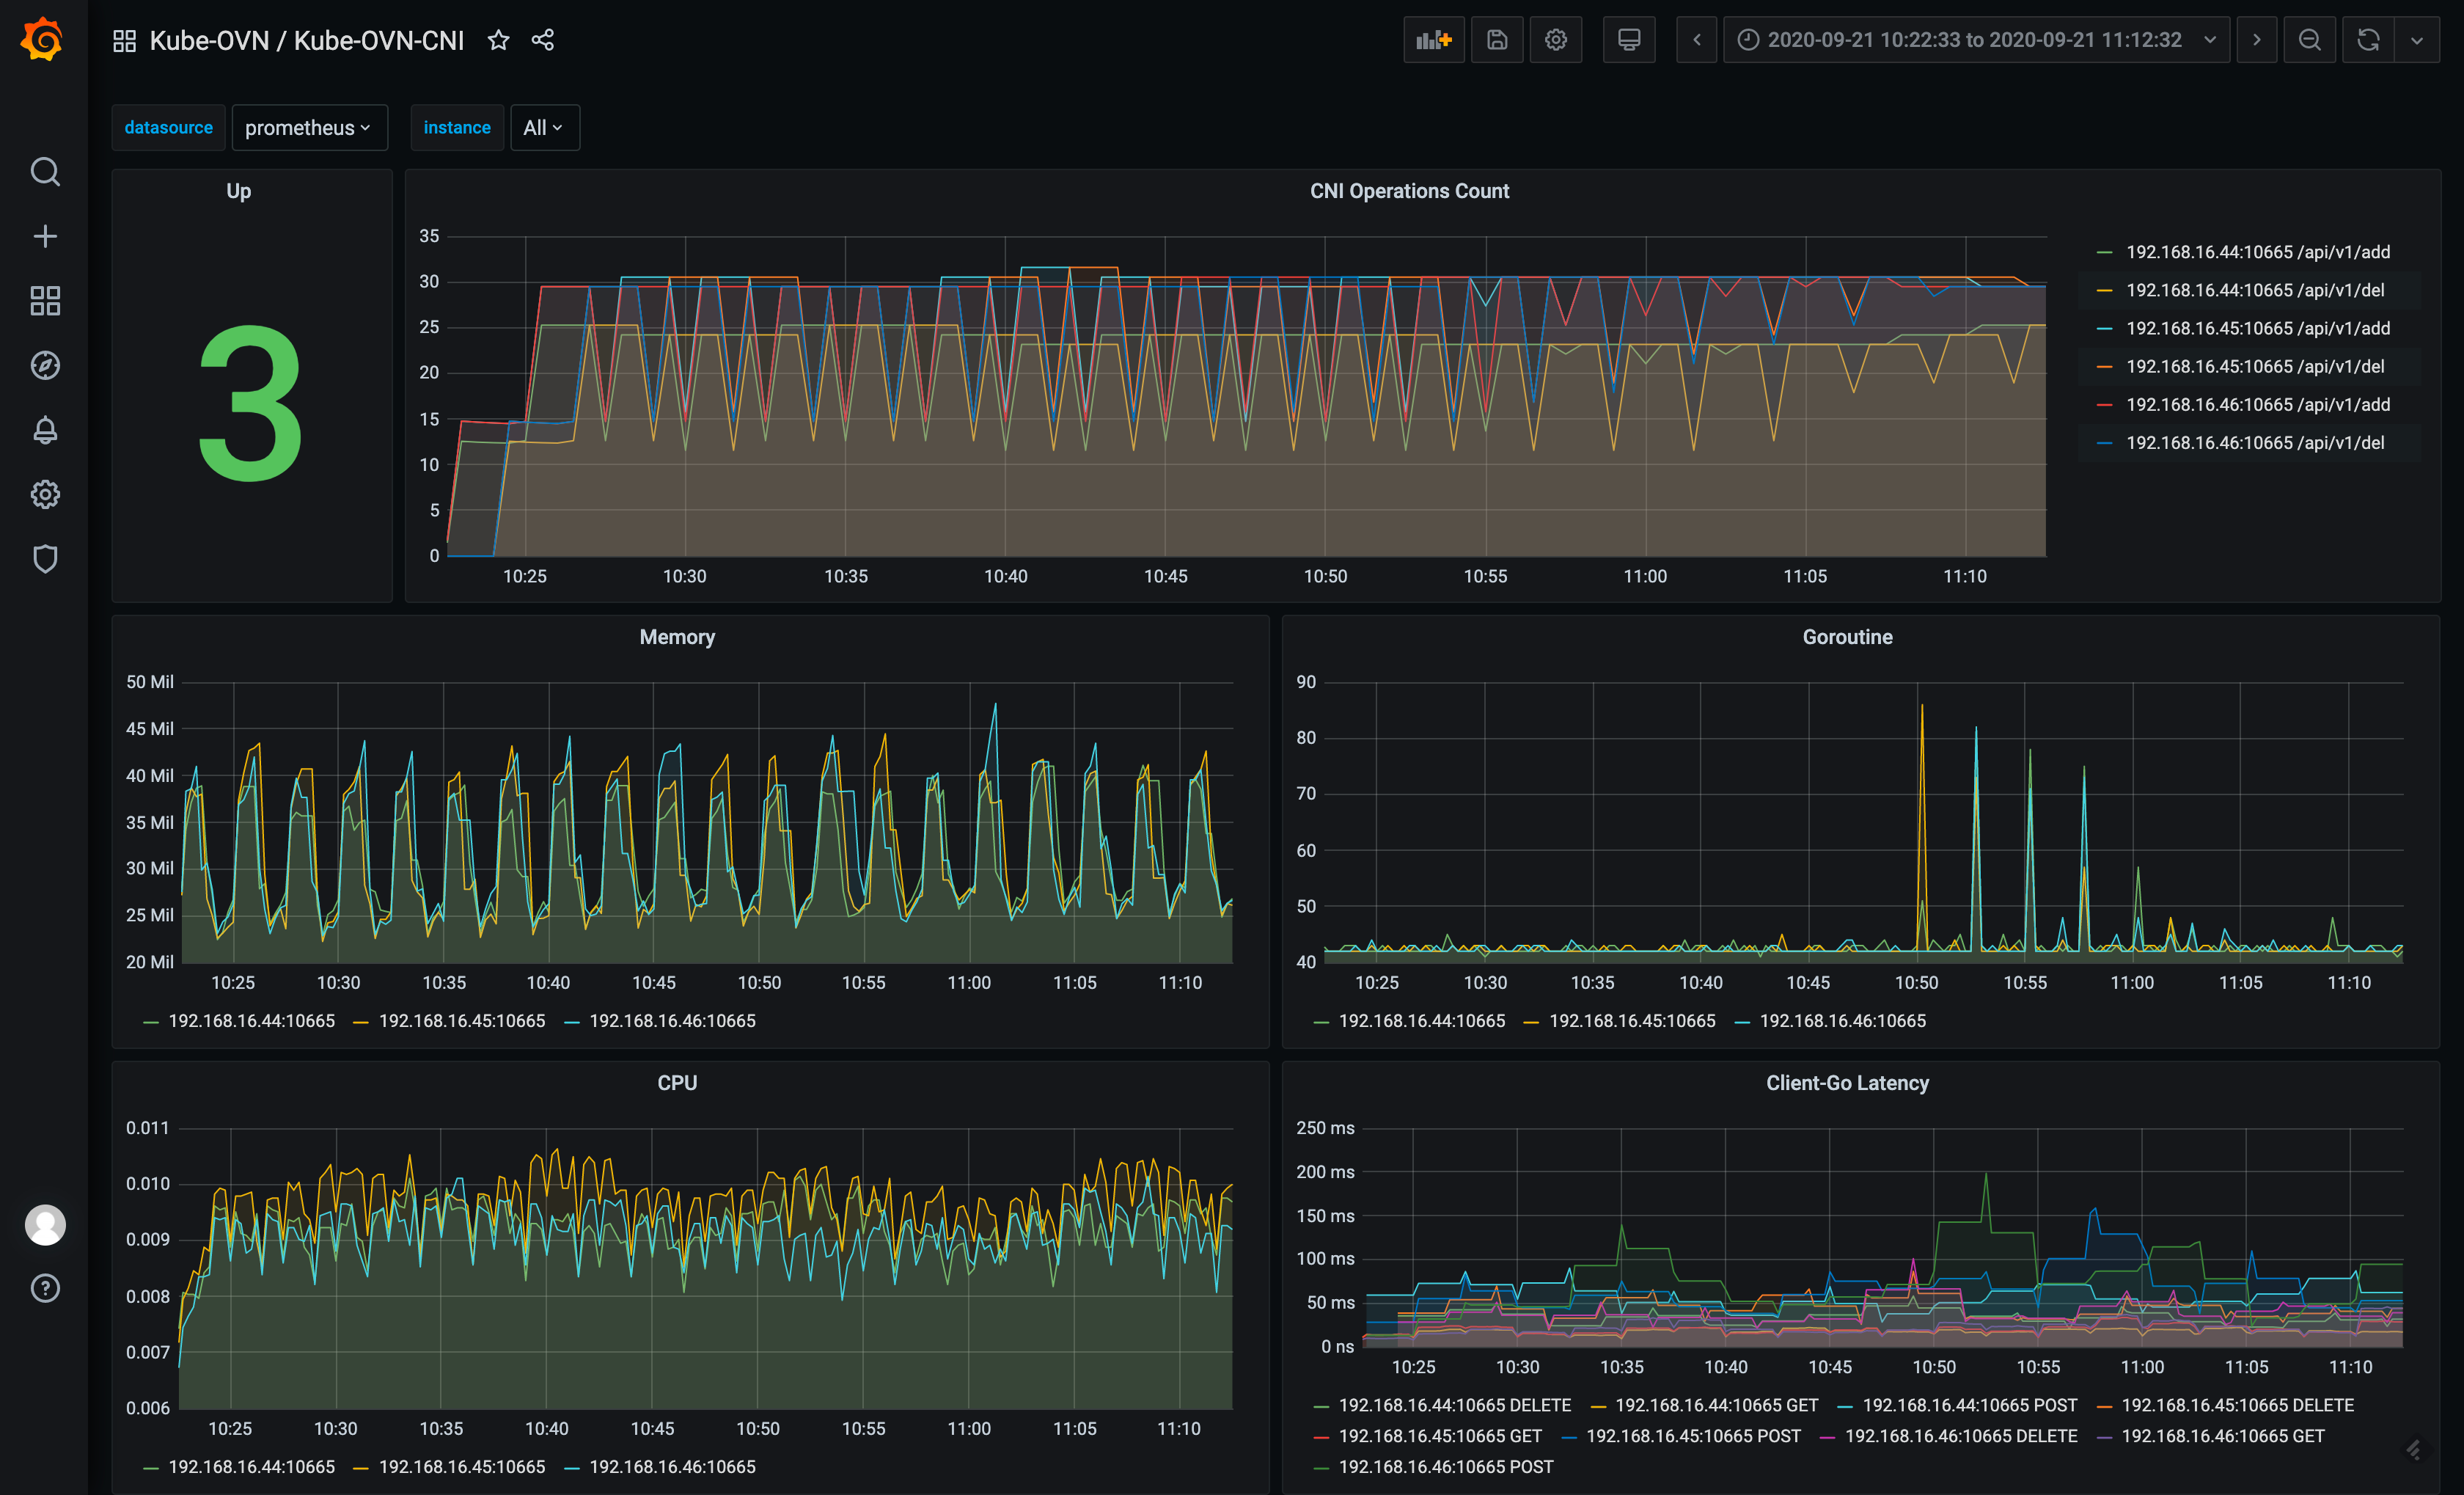
kube-ovn-cni dashboard:
Created: June 30, 2022