Config Native Prometheus
Kube-OVN provides rich monitoring data for OVN/OVS health status checks and connectivity checks of container and host networks, and Kube-OVN is configured with ServiceMonitor for Prometheus to dynamically obtain monitoring metrics.
In some cases, where only Prometheus Server is installed and no other components are installed, you can dynamically obtain monitoring data for the cluster environment by modifying the configuration of Prometheus.
Config Prometheus
The following configuration documentation, referenced from Prometheus Service Discovery.
Permission Configuration
Prometheus is deployed in the cluster and needs to access the k8s apiserver to query the monitoring data of the containers.
Refer to the following yaml to configure the permissions required by Prometheus:
apiVersion: rbac.authorization.k8s.io/v1
kind: ClusterRole
metadata:
  name: prometheus
rules:
- apiGroups: [""]
  resources:
  - nodes
  - nodes/proxy
  - services
  - endpoints
  - pods
  verbs: ["get", "list", "watch"]
- apiGroups:
  - extensions
  resources:
  - ingresses
  verbs: ["get", "list", "watch"]
- nonResourceURLs: ["/metrics"]
  verbs: ["get"]
---
apiVersion: v1
kind: ServiceAccount
metadata:
  name: prometheus
  namespace: default
---
apiVersion: rbac.authorization.k8s.io/v1
kind: ClusterRoleBinding
metadata:
  name: prometheus
roleRef:
  apiGroup: rbac.authorization.k8s.io
  kind: ClusterRole
  name: prometheus
subjects:
- kind: ServiceAccount
  name: prometheus
  namespace: default
Prometheus ConfigMap
The startup of Prometheus relies on the configuration file prometheus.yml, the contents of which can be configured in ConfigMap and dynamically mounted to the Pod.
Create the ConfigMap file used by Prometheus by referring to the following yaml:
apiVersion: v1
kind: ConfigMap
metadata:
  name: prometheus-config
data:
  prometheus.yml: |-
    global:
      scrape_interval:     15s
      evaluation_interval: 15s
    scrape_configs:
    - job_name: 'prometheus'
      static_configs:
      - targets: ['localhost:9090']

    - job_name: 'kubernetes-nodes'
      tls_config:
        ca_file: /var/run/secrets/kubernetes.io/serviceaccount/ca.crt
      bearer_token_file: /var/run/secrets/kubernetes.io/serviceaccount/token
      kubernetes_sd_configs:
      - role: node

    - job_name: 'kubernetes-service'
      tls_config:
        ca_file: /var/run/secrets/kubernetes.io/serviceaccount/ca.crt
      bearer_token_file: /var/run/secrets/kubernetes.io/serviceaccount/token
      kubernetes_sd_configs:
      - role: service

    - job_name: 'kubernetes-endpoints'
      tls_config:
        ca_file: /var/run/secrets/kubernetes.io/serviceaccount/ca.crt
      bearer_token_file: /var/run/secrets/kubernetes.io/serviceaccount/token
      kubernetes_sd_configs:
      - role: endpoints

    - job_name: 'kubernetes-ingress'
      tls_config:
        ca_file: /var/run/secrets/kubernetes.io/serviceaccount/ca.crt
      bearer_token_file: /var/run/secrets/kubernetes.io/serviceaccount/token
      kubernetes_sd_configs:
      - role: ingress

    - job_name: 'kubernetes-pods'
      tls_config:
        ca_file: /var/run/secrets/kubernetes.io/serviceaccount/ca.crt
      bearer_token_file: /var/run/secrets/kubernetes.io/serviceaccount/token
      kubernetes_sd_configs:
      - role: pod
Prometheus provides role-based querying of Kubernetes resource monitoring operations, which can be configured in the official documentation kubernetes_sd_config。
Deploy Prometheus
Deploy Prometheus Server by referring to the following yaml:
apiVersion: apps/v1
kind: Deployment
metadata:
  labels:
    app: prometheus
  name: prometheus
  namespace: default
spec:
  replicas: 1
  selector:
    matchLabels:
      app: prometheus
  strategy:
    rollingUpdate:
      maxSurge: 25%
      maxUnavailable: 25%
    type: RollingUpdate
  template:
    metadata:
      labels:
        app: prometheus
    spec:
      serviceAccountName: prometheus
      serviceAccount: prometheus
      containers:
      - image: prom/prometheus:latest
        imagePullPolicy: IfNotPresent
        name: prometheus
        command:
        - "/bin/prometheus"
        args:
        - "--config.file=/etc/prometheus/prometheus.yml"
        ports:
        - containerPort: 9090
          protocol: TCP
        volumeMounts:
        - mountPath: "/etc/prometheus"
          name: prometheus-config
      volumes:
      - name: prometheus-config
        configMap:
          name: prometheus-config
Deploy Prometheus Service by referring to the following yaml:
kind: Service
apiVersion: v1
metadata:
  name: prometheus
  namespace: default
  labels:
    name: prometheus
spec:
  ports:
    - name: test
      protocol: TCP
      port: 9090
      targetPort: 9090
  type: NodePort
  selector:
    app: prometheus
  sessionAffinity: None
After exposing Prometheus through NodePort, Prometheus can be accessed through the node address.
Prometheus Metrics Config
View information about Prometheus on the environment:
# kubectl get svc
NAME         TYPE        CLUSTER-IP     EXTERNAL-IP   PORT(S)          AGE
kubernetes   ClusterIP   10.4.0.1       <none>        443/TCP          8d
prometheus   NodePort    10.4.102.222   <none>        9090:32611/TCP   8d
# kubectl get pod -o wide
NAME                          READY   STATUS    RESTARTS   AGE    IP          NODE              NOMINATED NODE   READINESS GATES
prometheus-7544b6b84d-v9m8s   1/1     Running   0          3d5h   10.3.0.7    192.168.137.219   <none>           <none>
# kubectl get endpoints -o wide
NAME         ENDPOINTS                                                        AGE
kubernetes   192.168.136.228:6443,192.168.136.232:6443,192.168.137.219:6443   8d
prometheus   10.3.0.7:9090                                                    8d
Access Prometheus via NodePort to see the data dynamically queried by Status/Service Discovery:
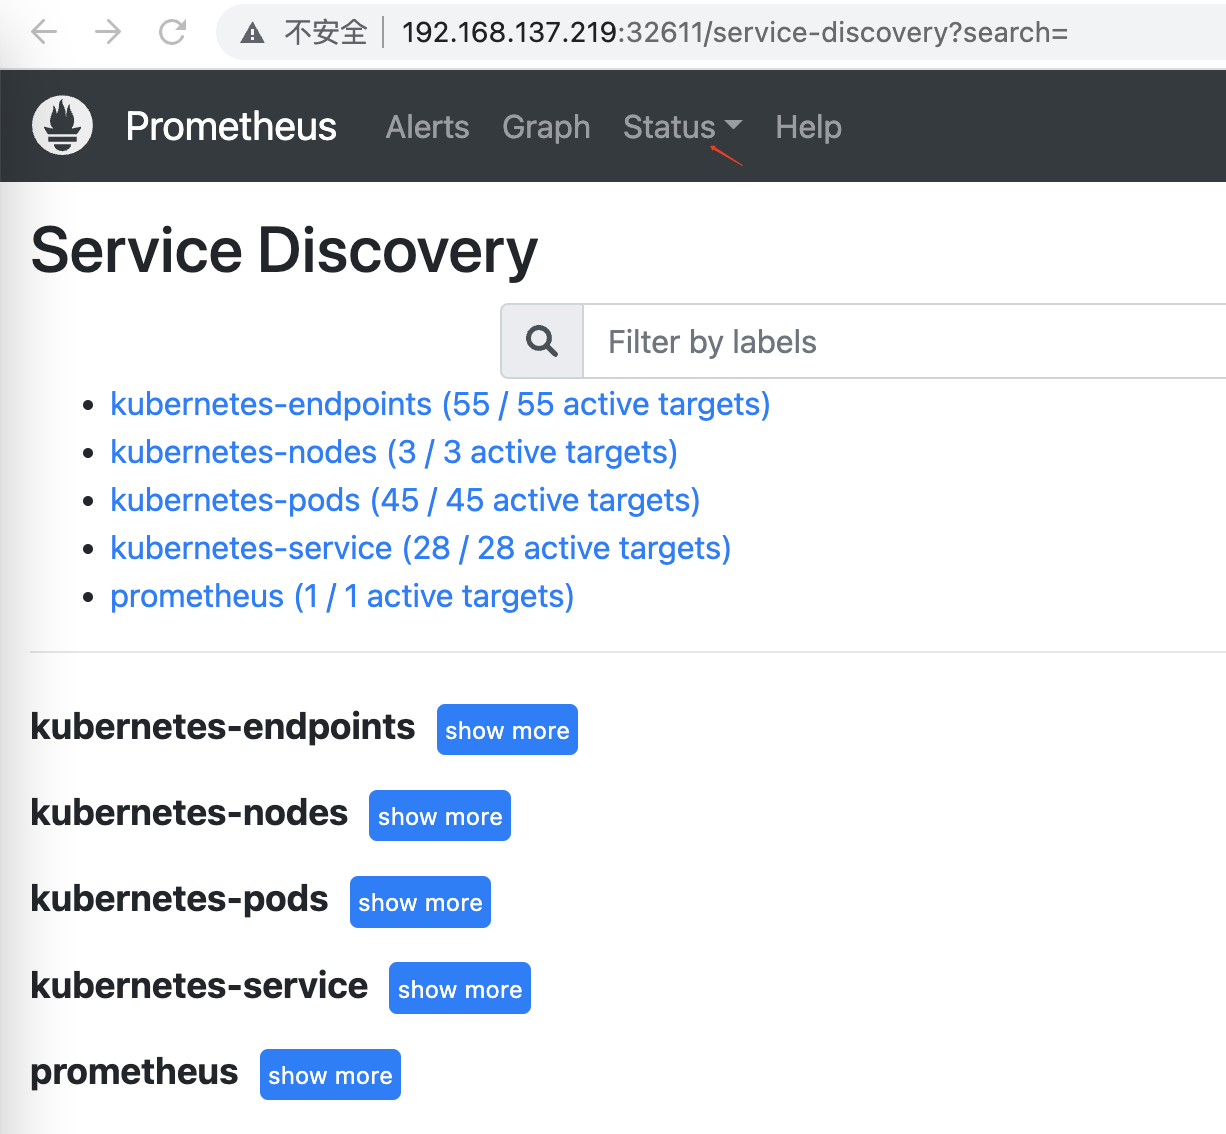
You can see that you can currently query all the service data information on the cluster.
Configure to Query Specified Resource
The ConfigMap configuration above queries all resource data. If you only need resource data for a certain role, you can add filter conditions.
Take Service as an example, modify the ConfigMap content to query only the service monitoring data:
    - job_name: 'kubernetes-service'
      tls_config:
        ca_file: /var/run/secrets/kubernetes.io/serviceaccount/ca.crt
      bearer_token_file: /var/run/secrets/kubernetes.io/serviceaccount/token
      kubernetes_sd_configs:
        - role: service
      relabel_configs:
        - source_labels: [__meta_kubernetes_service_annotation_prometheus_io_scrape]
          action: "keep"
          regex: "true"
        - action: labelmap
          regex: __meta_kubernetes_service_label_(.+)
        - source_labels: [__meta_kubernetes_namespace]
          target_label: kubernetes_namespace
        - source_labels: [__meta_kubernetes_service_name]
          target_label: kubernetes_service_name
        - source_labels: [__meta_kubernetes_service_annotation_prometheus_io_path]
          action: replace
          target_label: __metrics_path__
          regex: "(.+)"
Check the Kube-OVN Service in kube-system Namespace:
# kubectl get svc -n kube-system
NAME                  TYPE        CLUSTER-IP     EXTERNAL-IP   PORT(S)                  AGE
kube-dns              ClusterIP   10.4.0.10      <none>        53/UDP,53/TCP,9153/TCP   13d
kube-ovn-cni          ClusterIP   10.4.228.60    <none>        10665/TCP                13d
kube-ovn-controller   ClusterIP   10.4.172.213   <none>        10660/TCP                13d
kube-ovn-monitor      ClusterIP   10.4.242.9     <none>        10661/TCP                13d
kube-ovn-pinger       ClusterIP   10.4.122.52    <none>        8080/TCP                 13d
ovn-nb                ClusterIP   10.4.80.213    <none>        6641/TCP                 13d
ovn-northd            ClusterIP   10.4.126.234   <none>        6643/TCP                 13d
ovn-sb                ClusterIP   10.4.216.249   <none>        6642/TCP                 13d
Add annotation prometheus.io/scrape="true" to Service:
# kubectl annotate svc -n kube-system kube-ovn-cni  prometheus.io/scrape=true
service/kube-ovn-cni annotated
# kubectl annotate svc -n kube-system kube-ovn-controller  prometheus.io/scrape=true
service/kube-ovn-controller annotated
# kubectl annotate svc -n kube-system kube-ovn-monitor  prometheus.io/scrape=true
service/kube-ovn-monitor annotated
# kubectl annotate svc -n kube-system kube-ovn-pinger  prometheus.io/scrape=true
service/kube-ovn-pinger annotated
Check the configured Service information:
# kubectl get svc -o yaml -n kube-system kube-ovn-controller
apiVersion: v1
kind: Service
metadata:
  annotations:
    helm.sh/chart-version: v3.10.0-alpha.55
    helm.sh/original-name: kube-ovn-controller
    ovn.kubernetes.io/vpc: ovn-cluster
    prometheus.io/scrape: "true"                        // added annotation
  labels:
    app: kube-ovn-controller
  name: kube-ovn-controller
  namespace: kube-system
spec:
  clusterIP: 10.4.172.213
  clusterIPs:
  - 10.4.172.213
  internalTrafficPolicy: Cluster
  ipFamilies:
  - IPv4
  ipFamilyPolicy: SingleStack
  ports:
  - name: metrics
    port: 10660
    protocol: TCP
    targetPort: 10660
  selector:
    app: kube-ovn-controller
  sessionAffinity: None
  type: ClusterIP
status:
  loadBalancer: {}
Looking at the Prometheus Status Targets information, you can only see the Services with annotation:
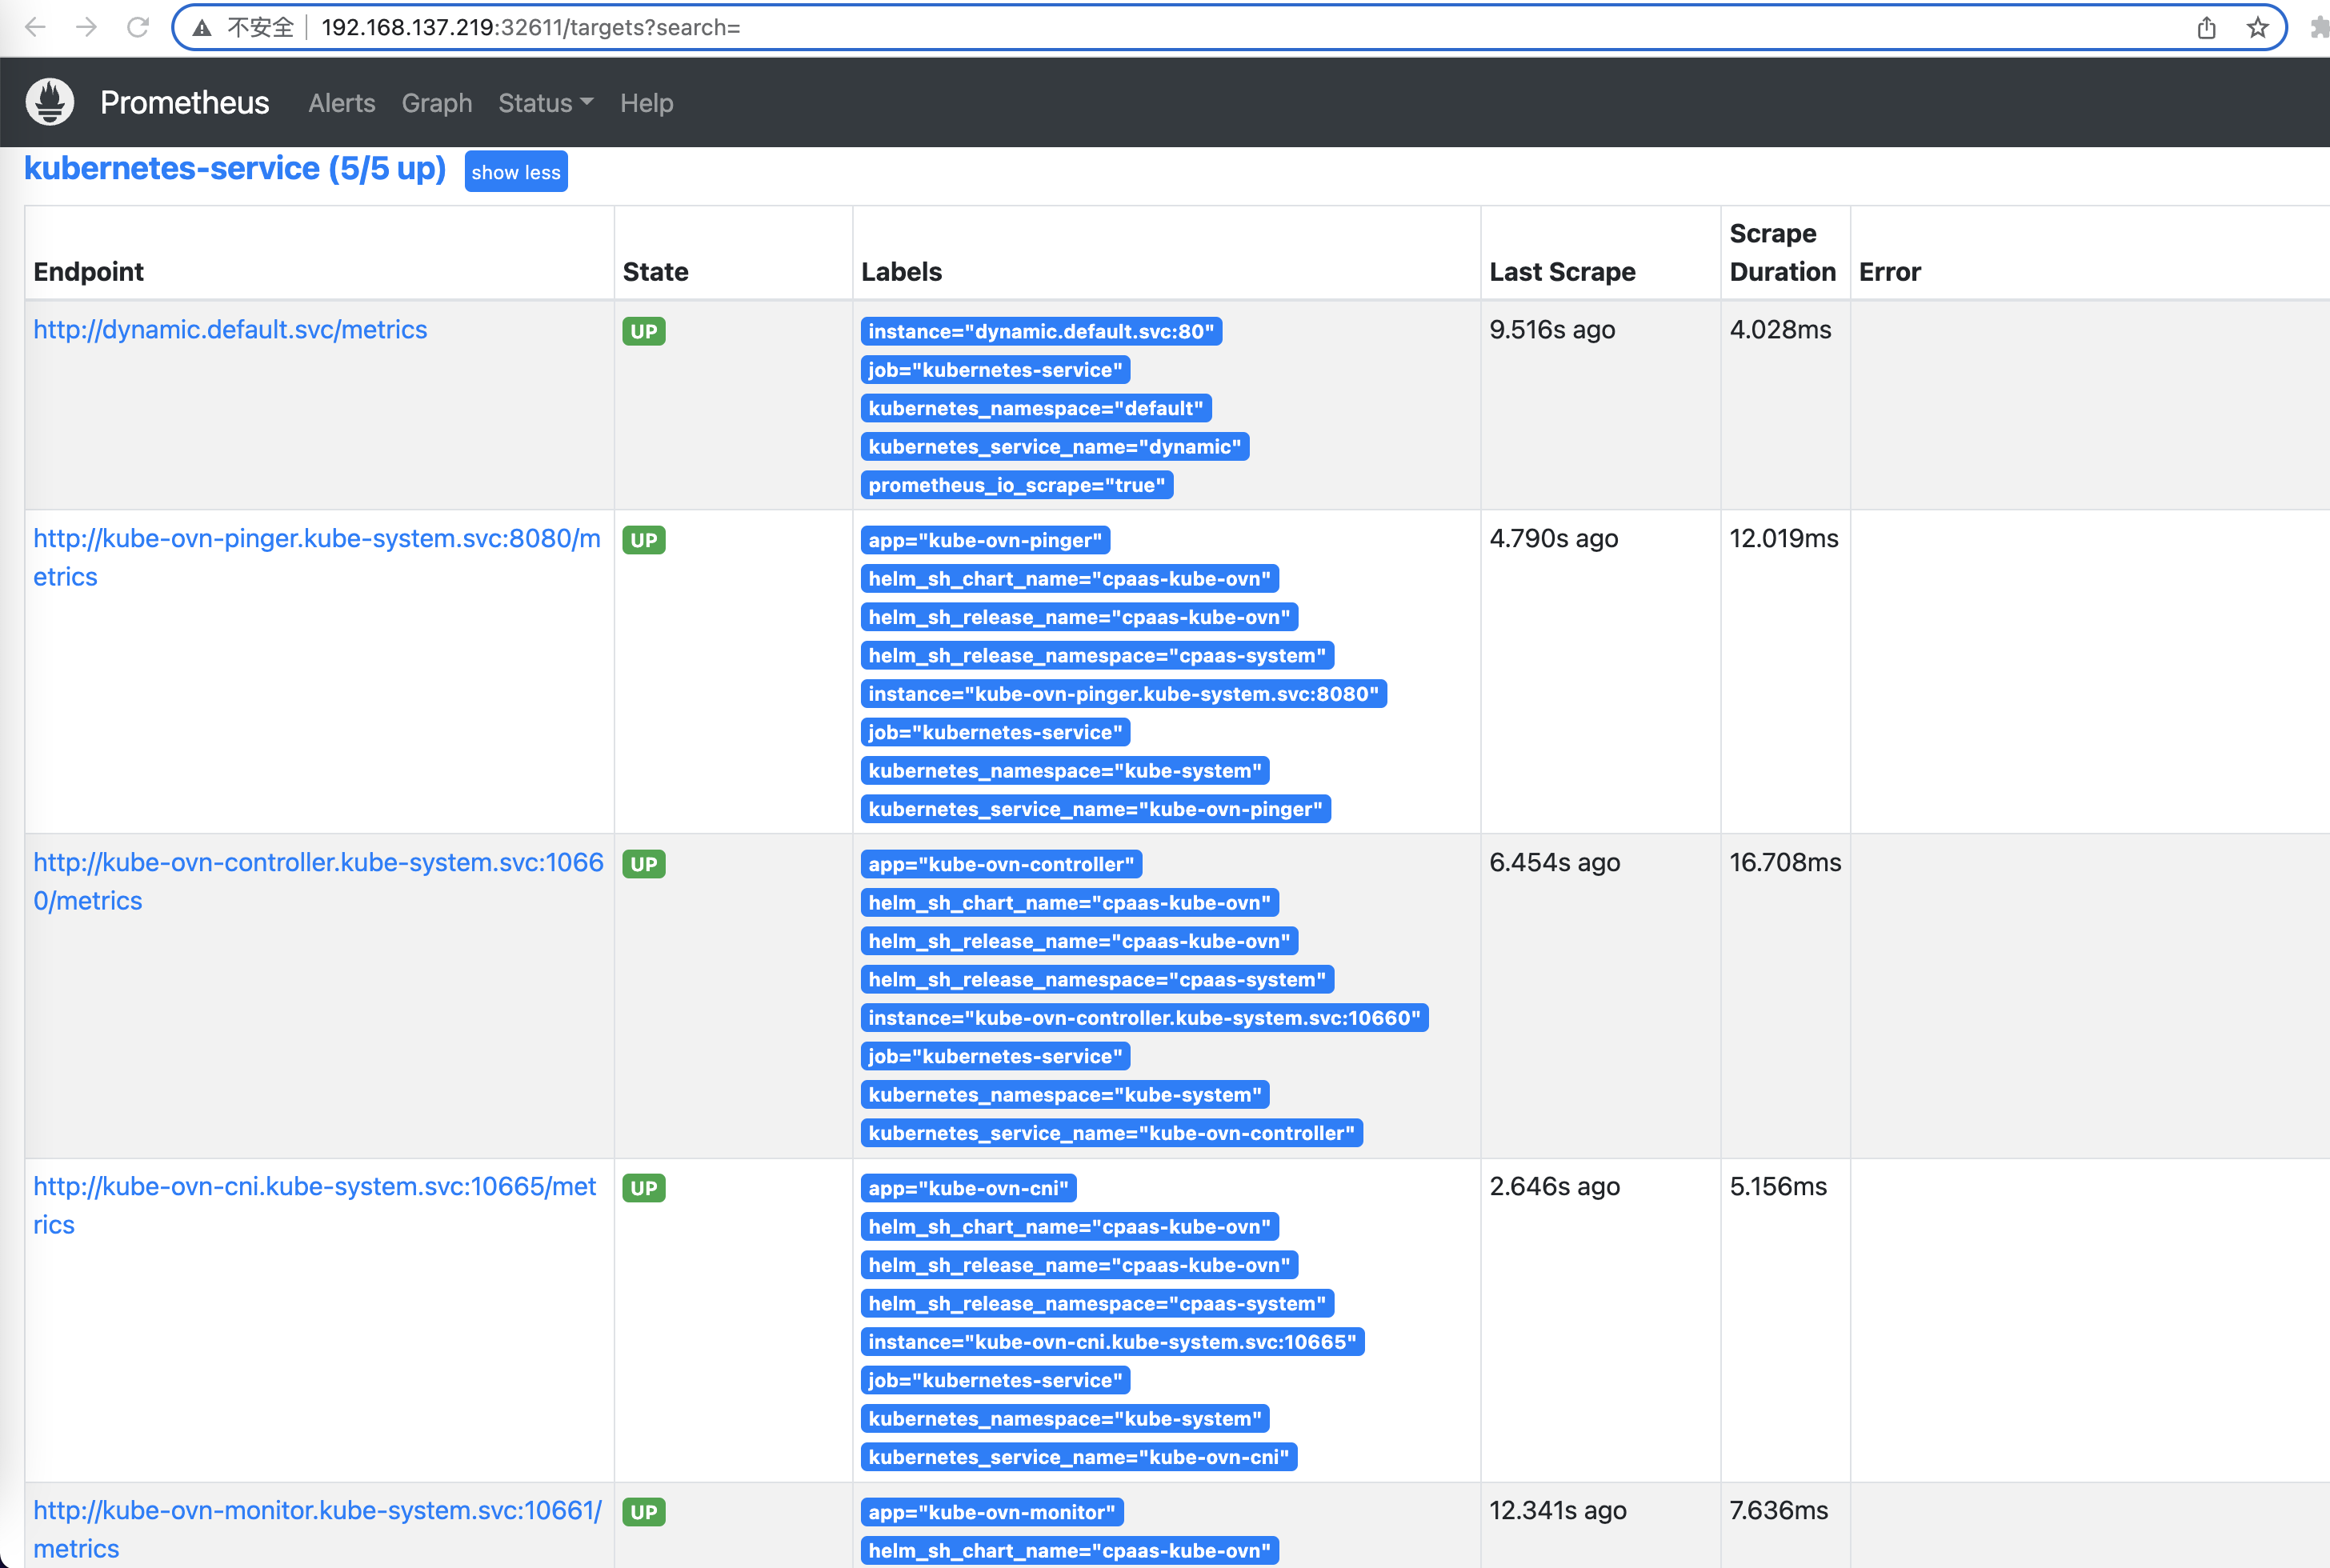
For more information about adding filter parameters to relabel, please check Prometheus-Relabel。
Created: September 6, 2022