Monitor and Dashboard
Kube-OVN can export network control plane information and network data plane quality information metrics to the external in formats supported by Prometheus.
We use the CRD provided by kube-prometheus to define the corresponding Prometheus monitoring rules. For all monitoring metrics supported by Kube-OVN, please refer to Kube-OVN Monitoring Metrics.
Install ServiceMonitor
Kube-OVN uses the ServiceMonitor CRD to manage monitoring output.
# network quality related monitoring metrics
kubectl apply -f https://raw.githubusercontent.com/kubeovn/kube-ovn/master/dist/monitoring/pinger-monitor.yaml
# kube-ovn-controller metrics
kubectl apply -f https://raw.githubusercontent.com/kubeovn/kube-ovn/master/dist/monitoring/controller-monitor.yaml
# kube-ovn-cni metrics
kubectl apply -f https://raw.githubusercontent.com/kubeovn/kube-ovn/master/dist/monitoring/cni-monitor.yaml
# ovn metrics
kubectl apply -f https://raw.githubusercontent.com/kubeovn/kube-ovn/master/dist/monitoring/ovn-monitor.yaml
The default interval for Prometheus pull is 15s, if you need to adjust it, modify the interval value in yaml.
Deploy Monitoring Resources with the kube-ovn-v2 Helm Chart
The kube-ovn-v2 Helm chart can create the bundled PrometheusRule and Grafana dashboard ConfigMaps. Both features are disabled by default. Install the Prometheus Operator CRDs first.
The following values enable both features and place their resources in the monitoring namespace:
prometheusRule:
  enabled: true
  namespace: monitoring
  labels:
    release: kube-prometheus-stack
grafanaDashboards:
  enabled: true
  namespace: monitoring
  datasource: Prometheus
When prometheusRule.namespace or grafanaDashboards.namespace is empty, it falls back to .Values.namespace. The monitoring namespace in this example must exist beforehand; helm --namespace kube-system sets only the Helm release namespace and does not create this override namespace. The four component ServiceMonitor resources are still created by their components in the chart namespace (.Values.namespace).
Pass this file when installing or upgrading the chart:
helm upgrade --install kube-ovn oci://ghcr.io/kubeovn/charts/kube-ovn-v2 \
  --namespace kube-system \
  --values monitoring-values.yaml
prometheusRule includes baseline alerts for the controller, pinger, subnet, and OVSDB. Most rules depend on scraping metrics exposed by the controller, OVN monitor, pinger, and agent. Enable these four ServiceMonitor switches: controller.serviceMonitor.enabled, monitor.serviceMonitor.enabled, pinger.serviceMonitor.enabled, and agent.serviceMonitor.enabled; alternatively, configure an external scrape that provides the same job and metric labels. Without those scrapes, scrape-dependent alerts do not fire.
KubeOvnControllerAbsent uses absent(up{job="kube-ovn-controller"}), so it still fires after about 15m when no target exists. Before scraping is wired up, silence or inhibit this alert in Alertmanager, or disable prometheusRule.enabled. Use prometheusRule.additionalGroups to append custom groups that follow the PrometheusRule.spec.groups[] schema.
grafanaDashboards.datasource must contain only letters, numbers, dots, underscores, or hyphens. It defaults to Prometheus. The chart replaces the ${DS_PROMETHEUS} placeholders in the bundled dashboards with this name.
When grafanaDashboards.enabled is enabled, Helm creates Dashboard ConfigMaps with the grafana_dashboard: "1" label. A configured Grafana sidecar imports them automatically; without a sidecar, use the manual import steps below.
Import Grafana Dashboard
Kube-OVN provides a predefined Grafana Dashboard to display control plane and data plane related metrics.
Download the corresponding Dashboard template:
# network quality related monitoring dashboard
wget https://raw.githubusercontent.com/kubeovn/kube-ovn/master/dist/monitoring/pinger-grafana.json
# kube-ovn-controller dashboard
wget https://raw.githubusercontent.com/kubeovn/kube-ovn/master/dist/monitoring/controller-grafana.json
# kube-ovn-cni dashboard
wget https://raw.githubusercontent.com/kubeovn/kube-ovn/master/dist/monitoring/cni-grafana.json
# ovn dashboard
wget https://raw.githubusercontent.com/kubeovn/kube-ovn/master/dist/monitoring/ovn-grafana.json
# ovs dashboard
wget https://raw.githubusercontent.com/kubeovn/kube-ovn/master/dist/monitoring/ovs-grafana.json
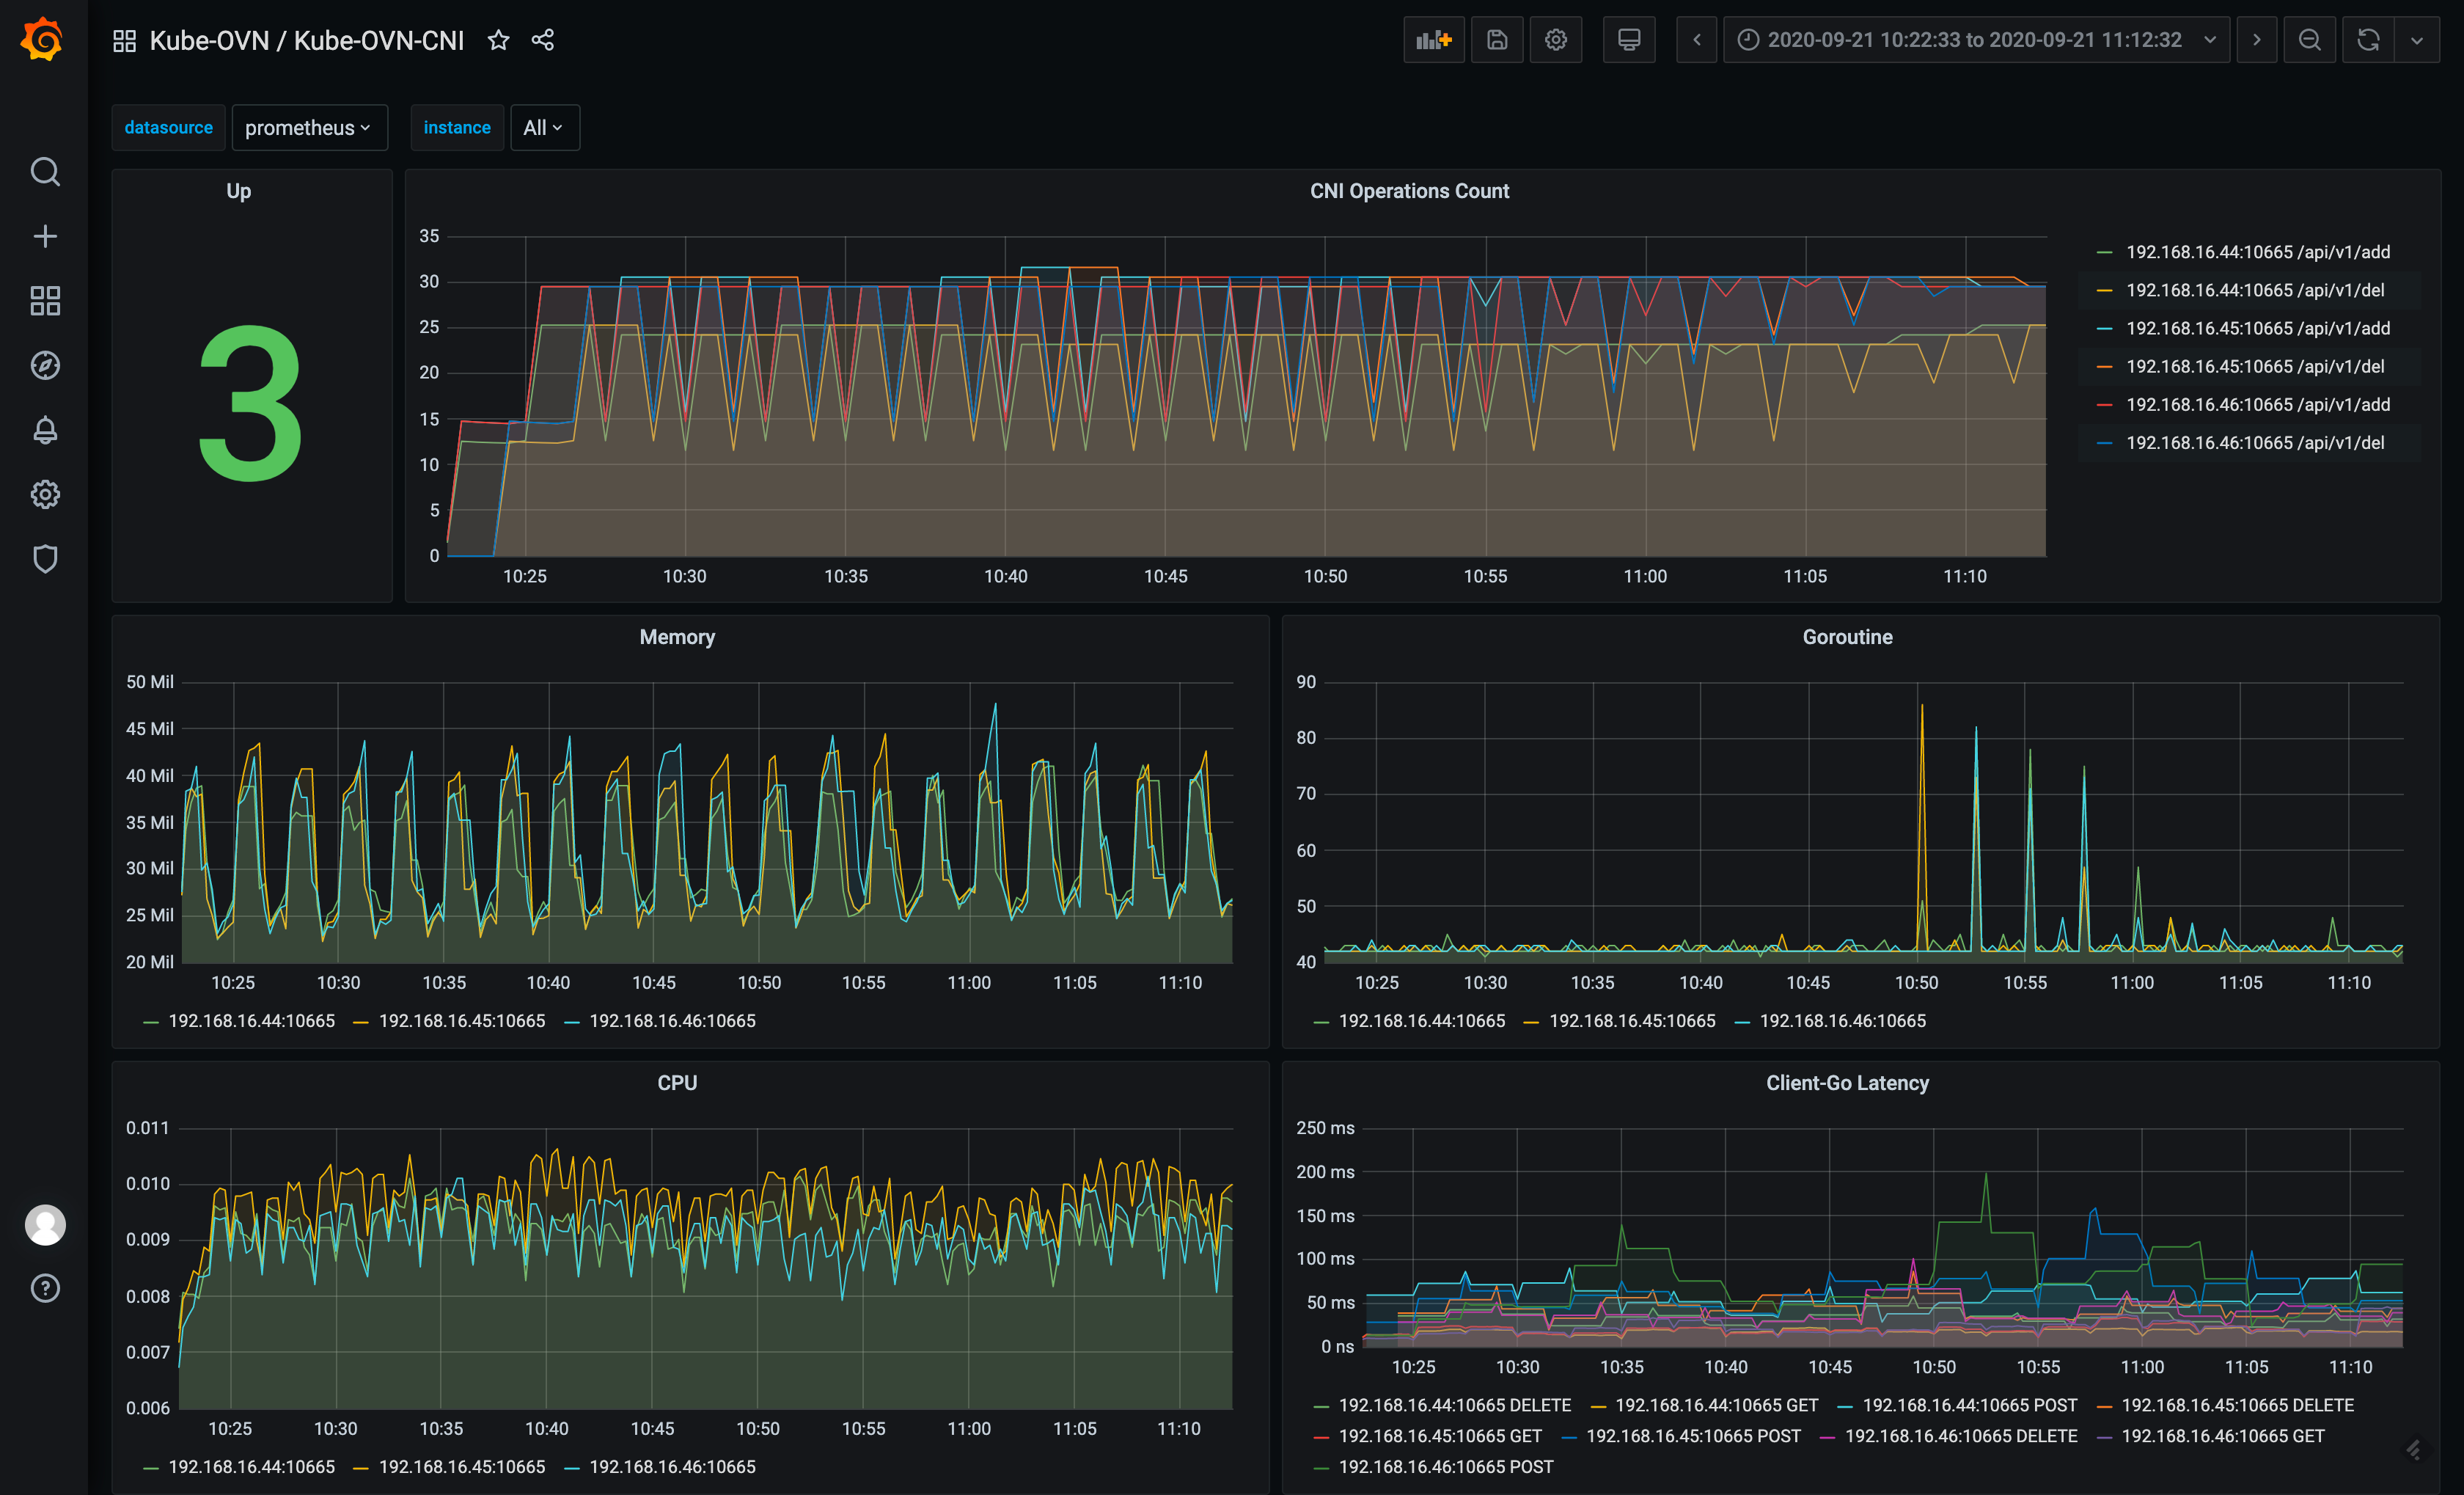
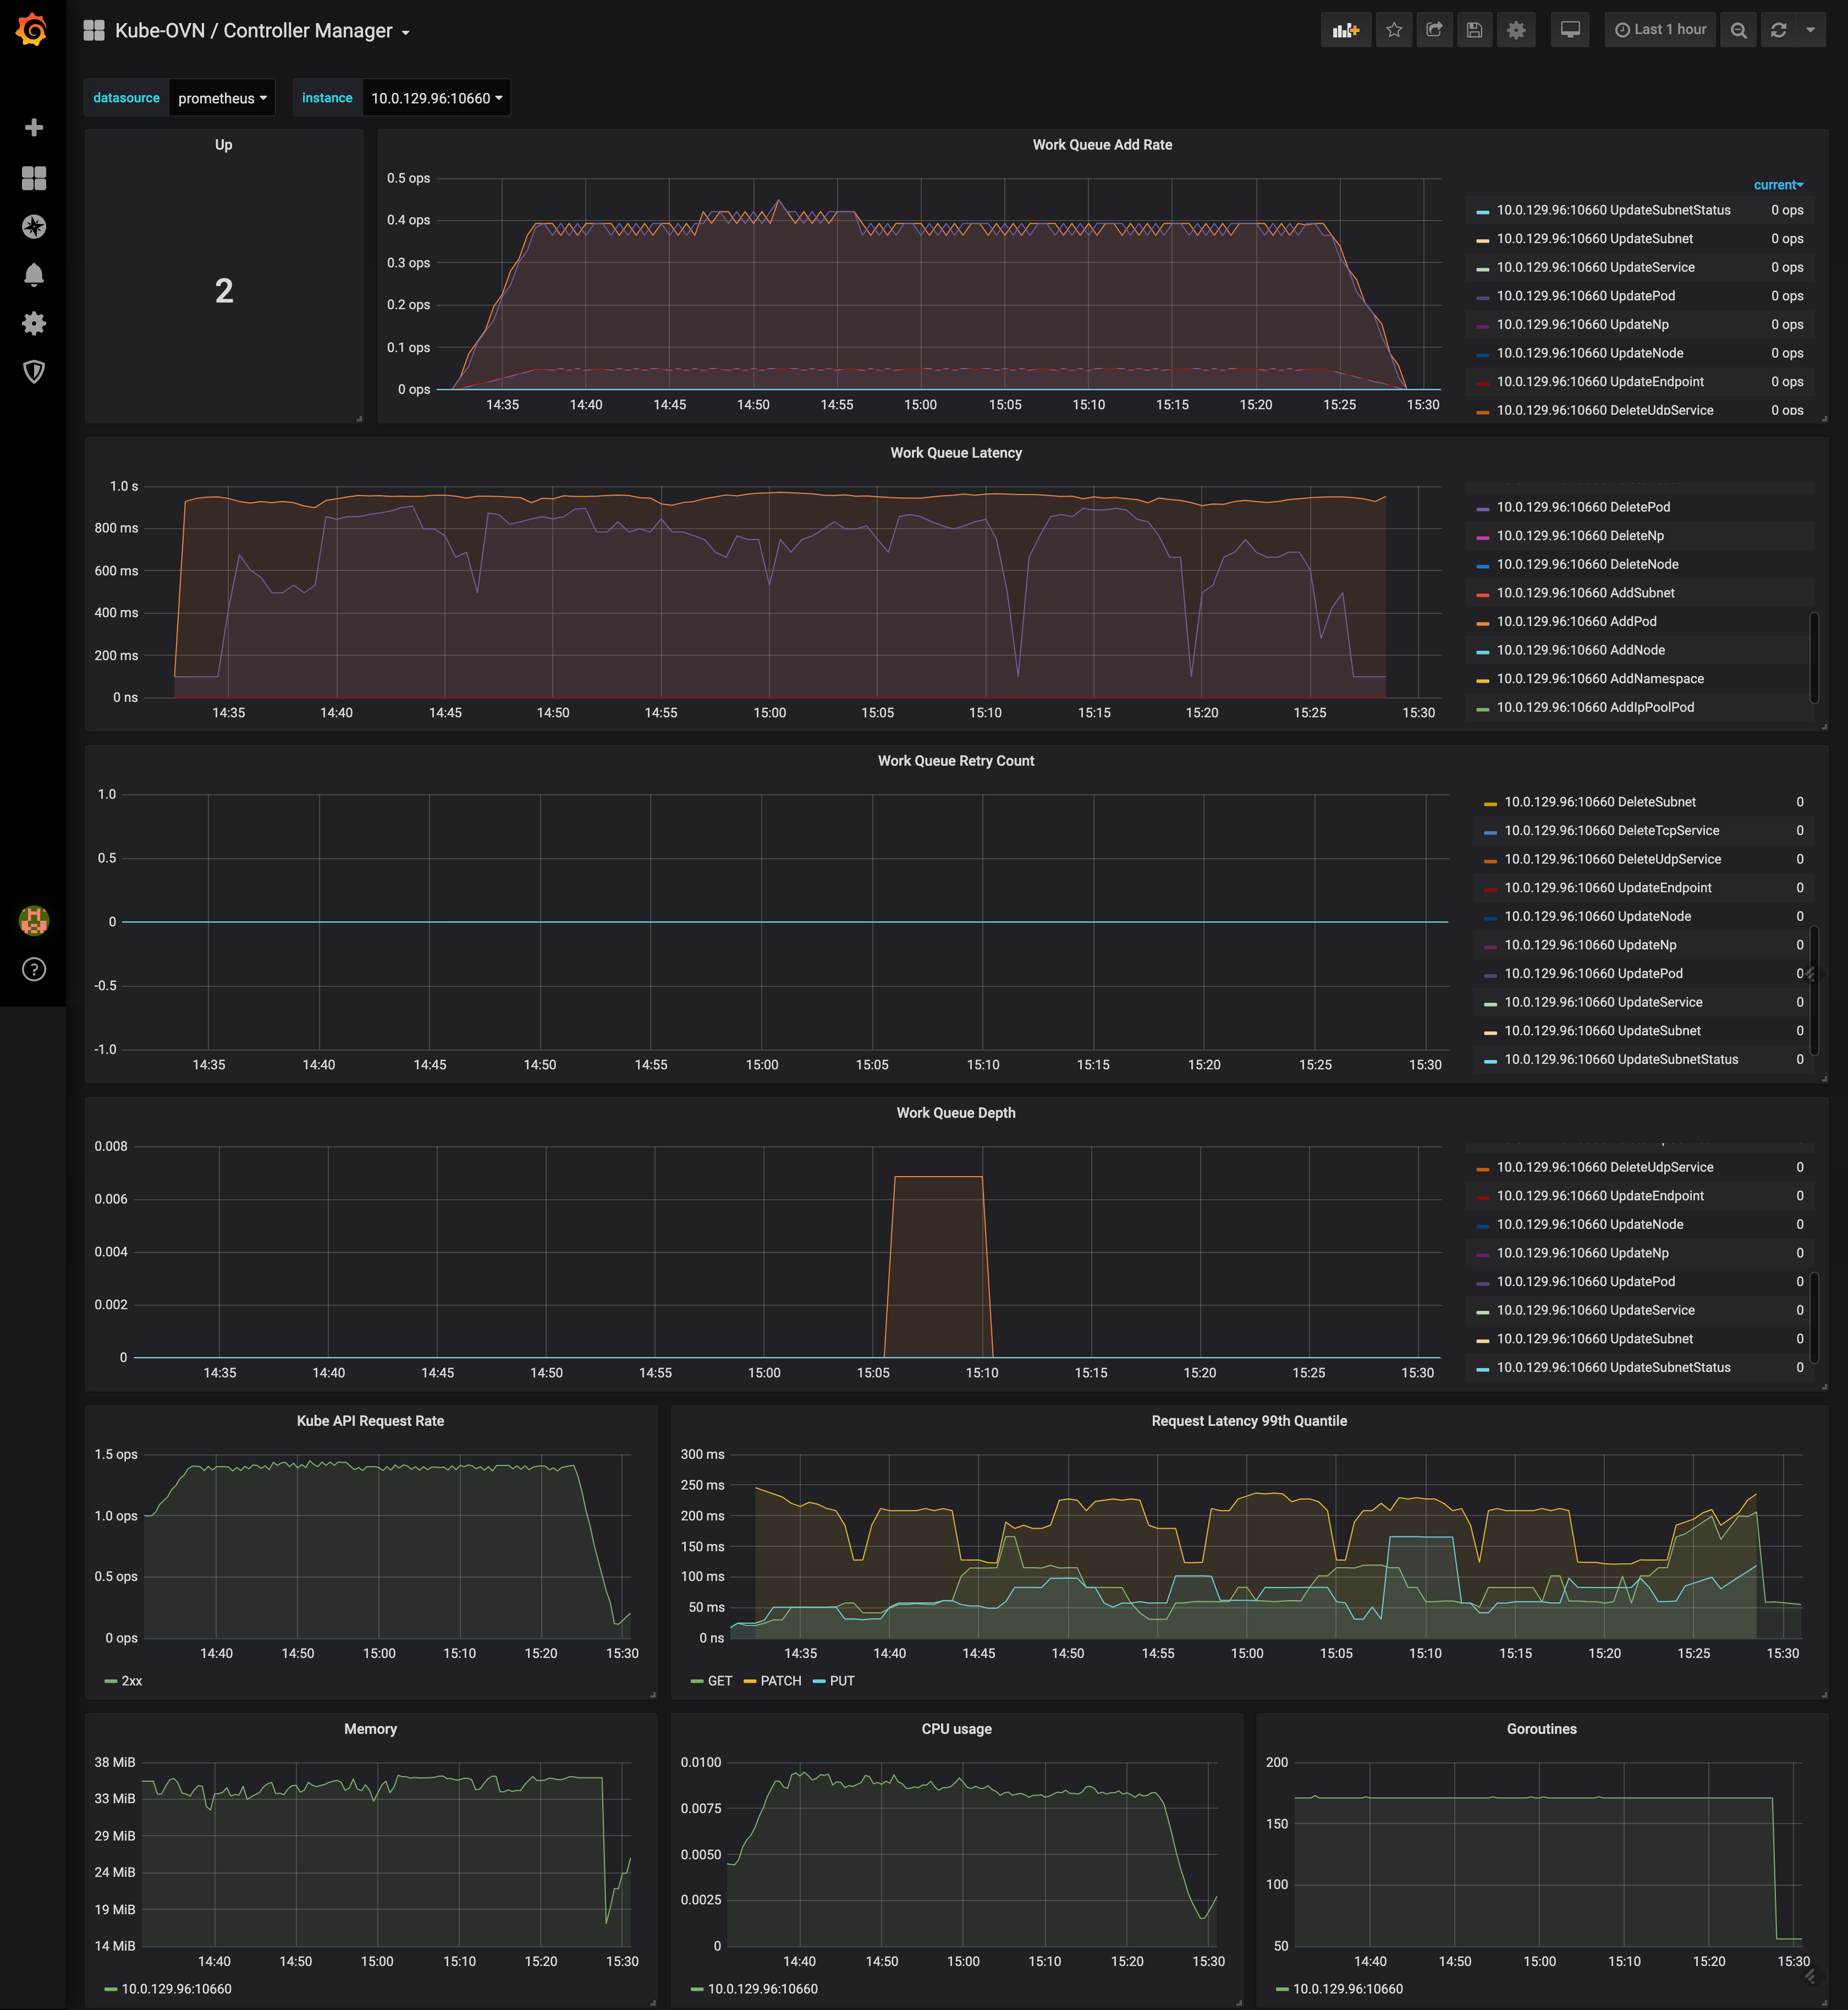
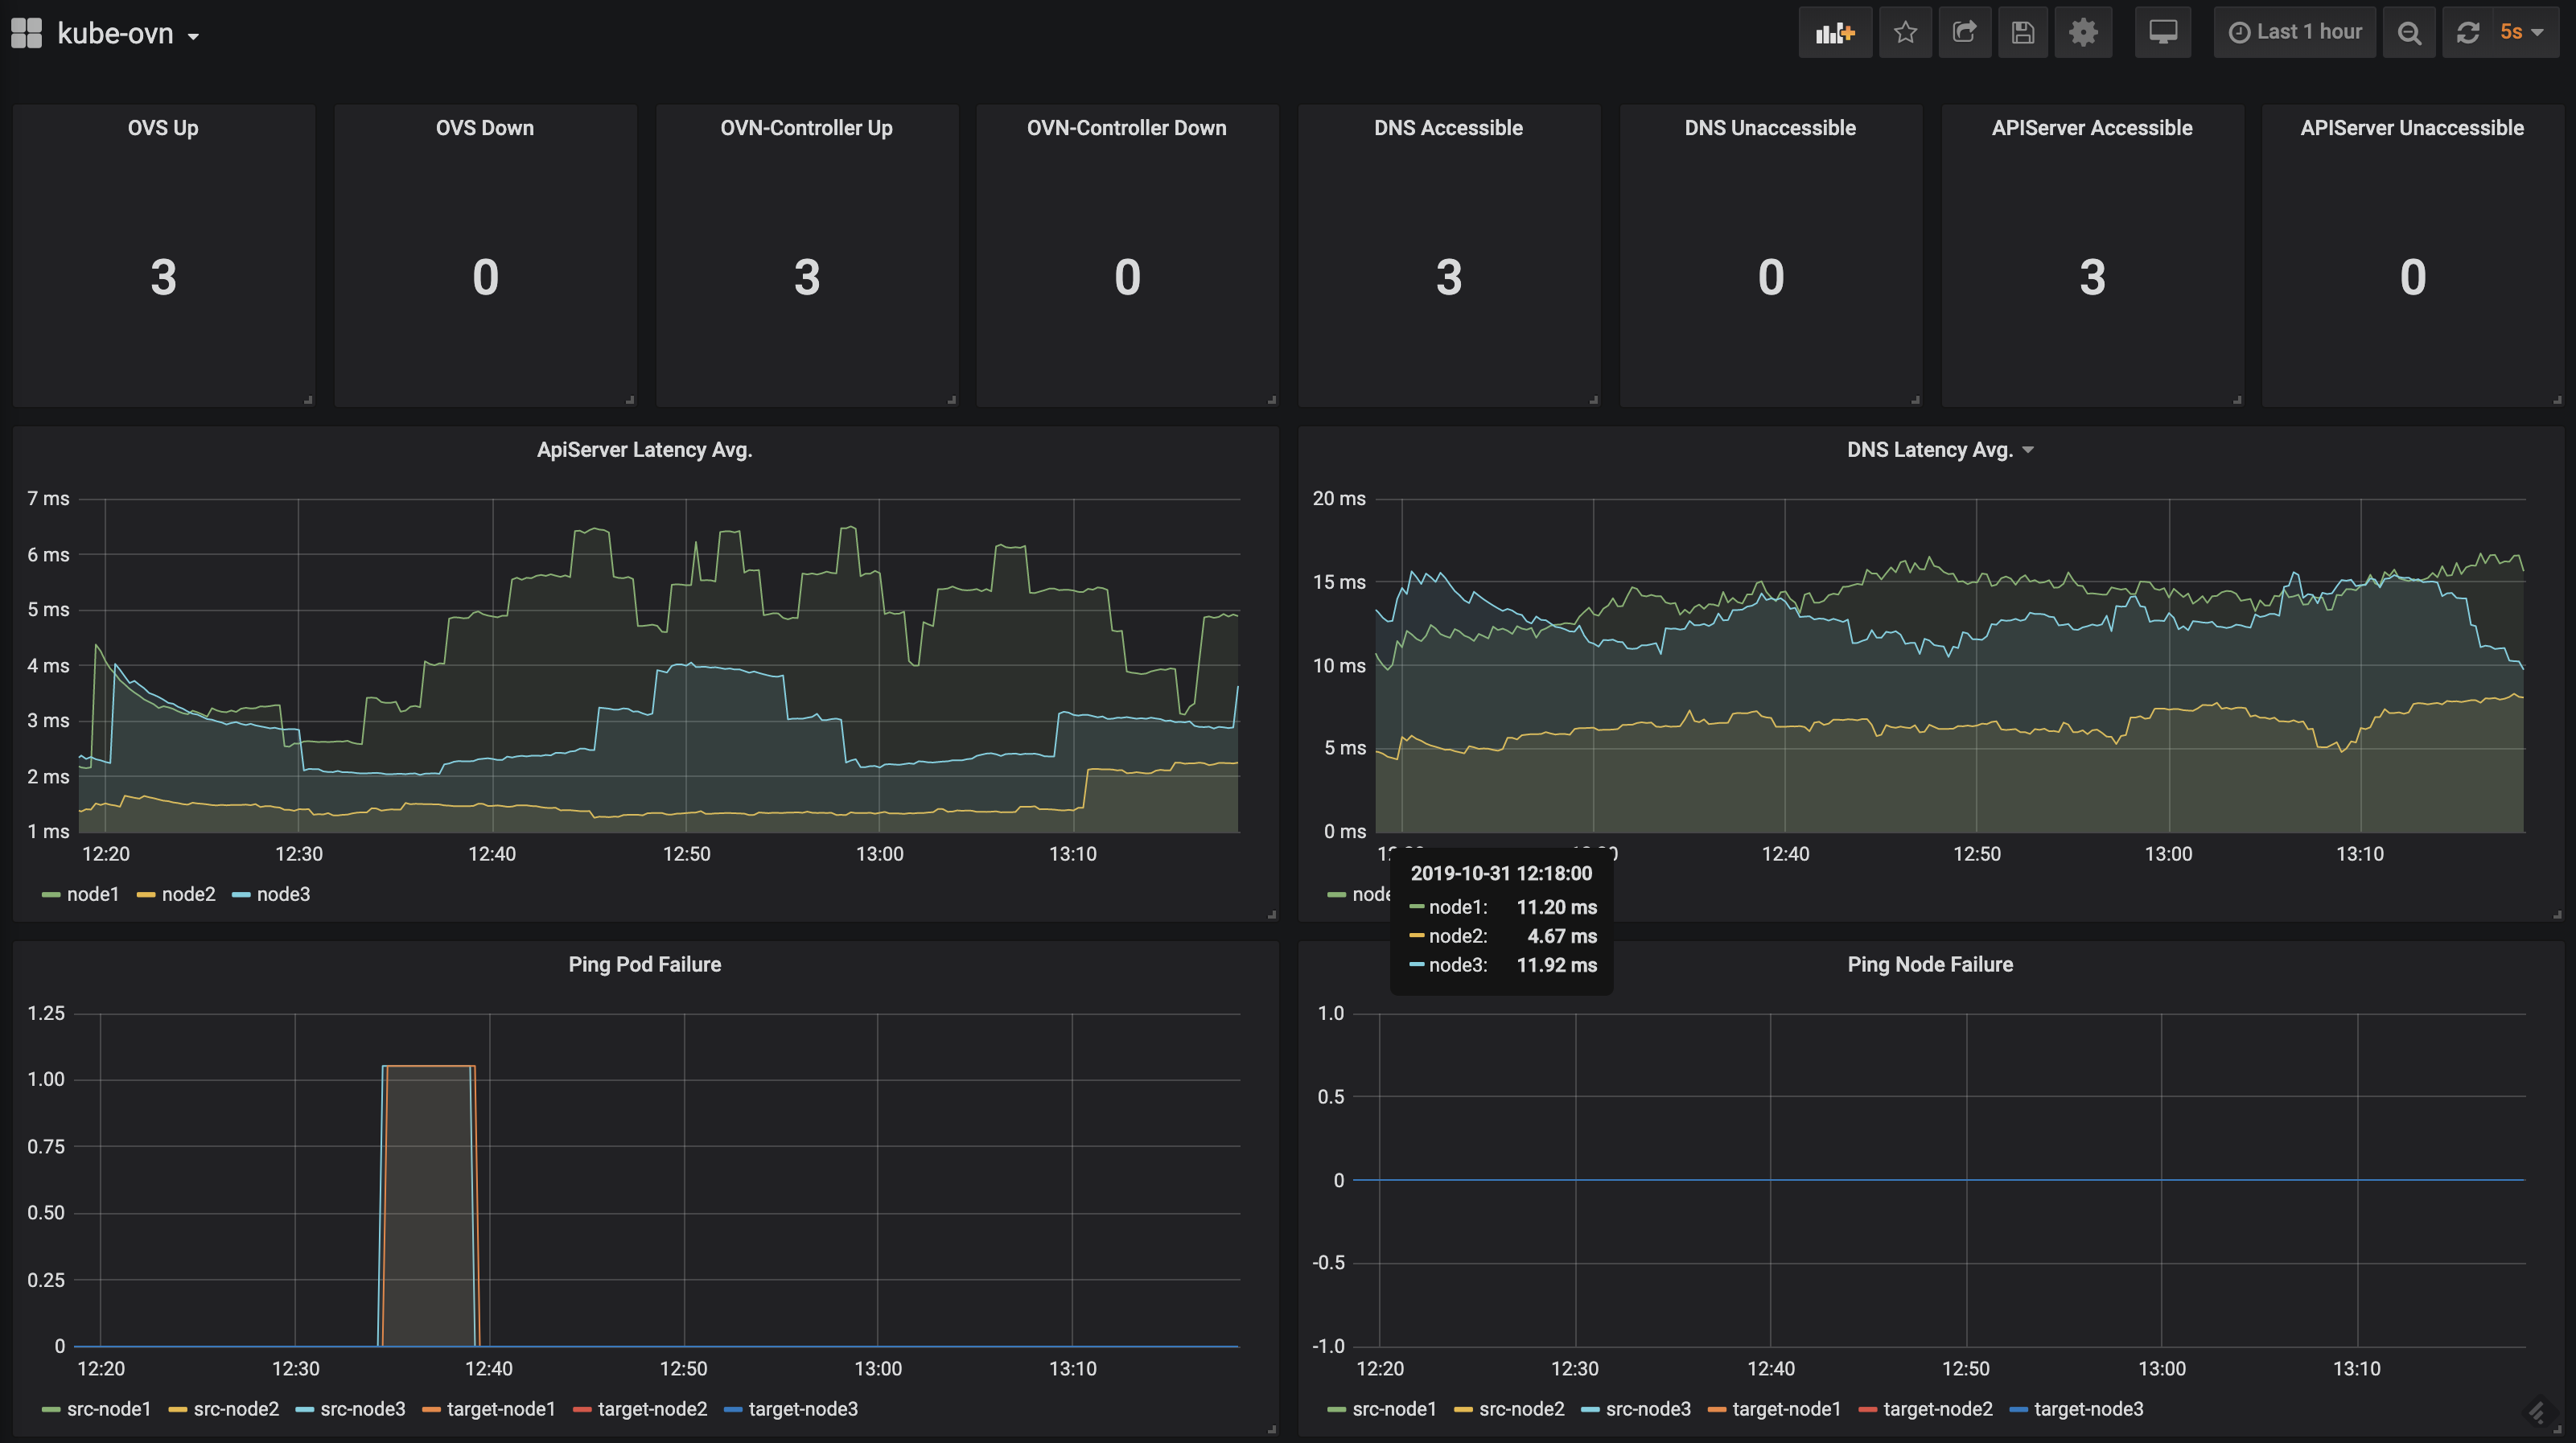
Import these templates into Grafana and set the data source to the corresponding Prometheus to see the following Dashboards.
kube-ovn-controller dashboard:
kube-ovn-pinger dashboard:
kube-ovn-cni dashboard: